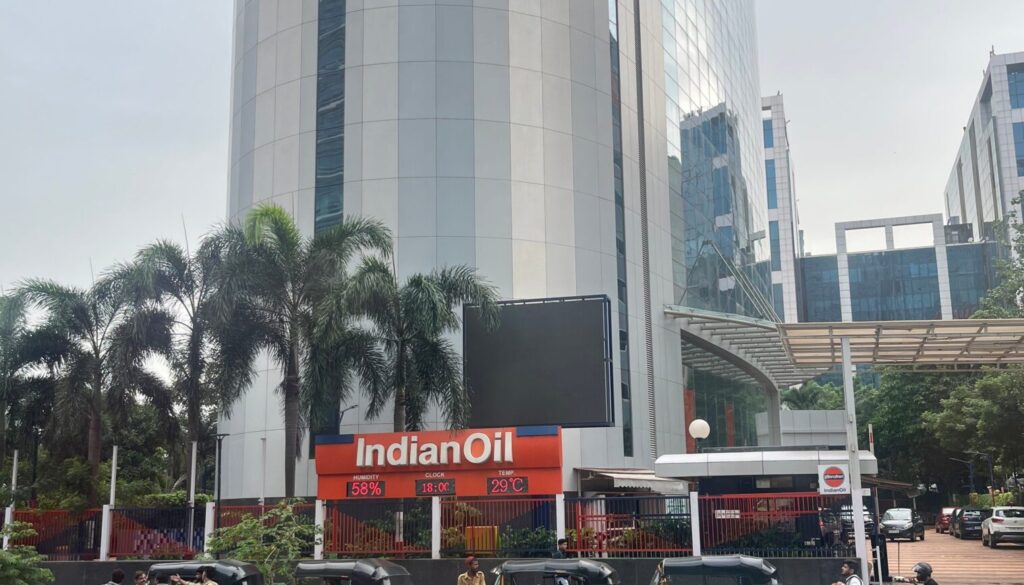
Indian Oil Corporation: Value Chain & Unit Economics
Indian Oil Corporation reported a consolidated net loss of ₹1,141 crore for the quarter ended
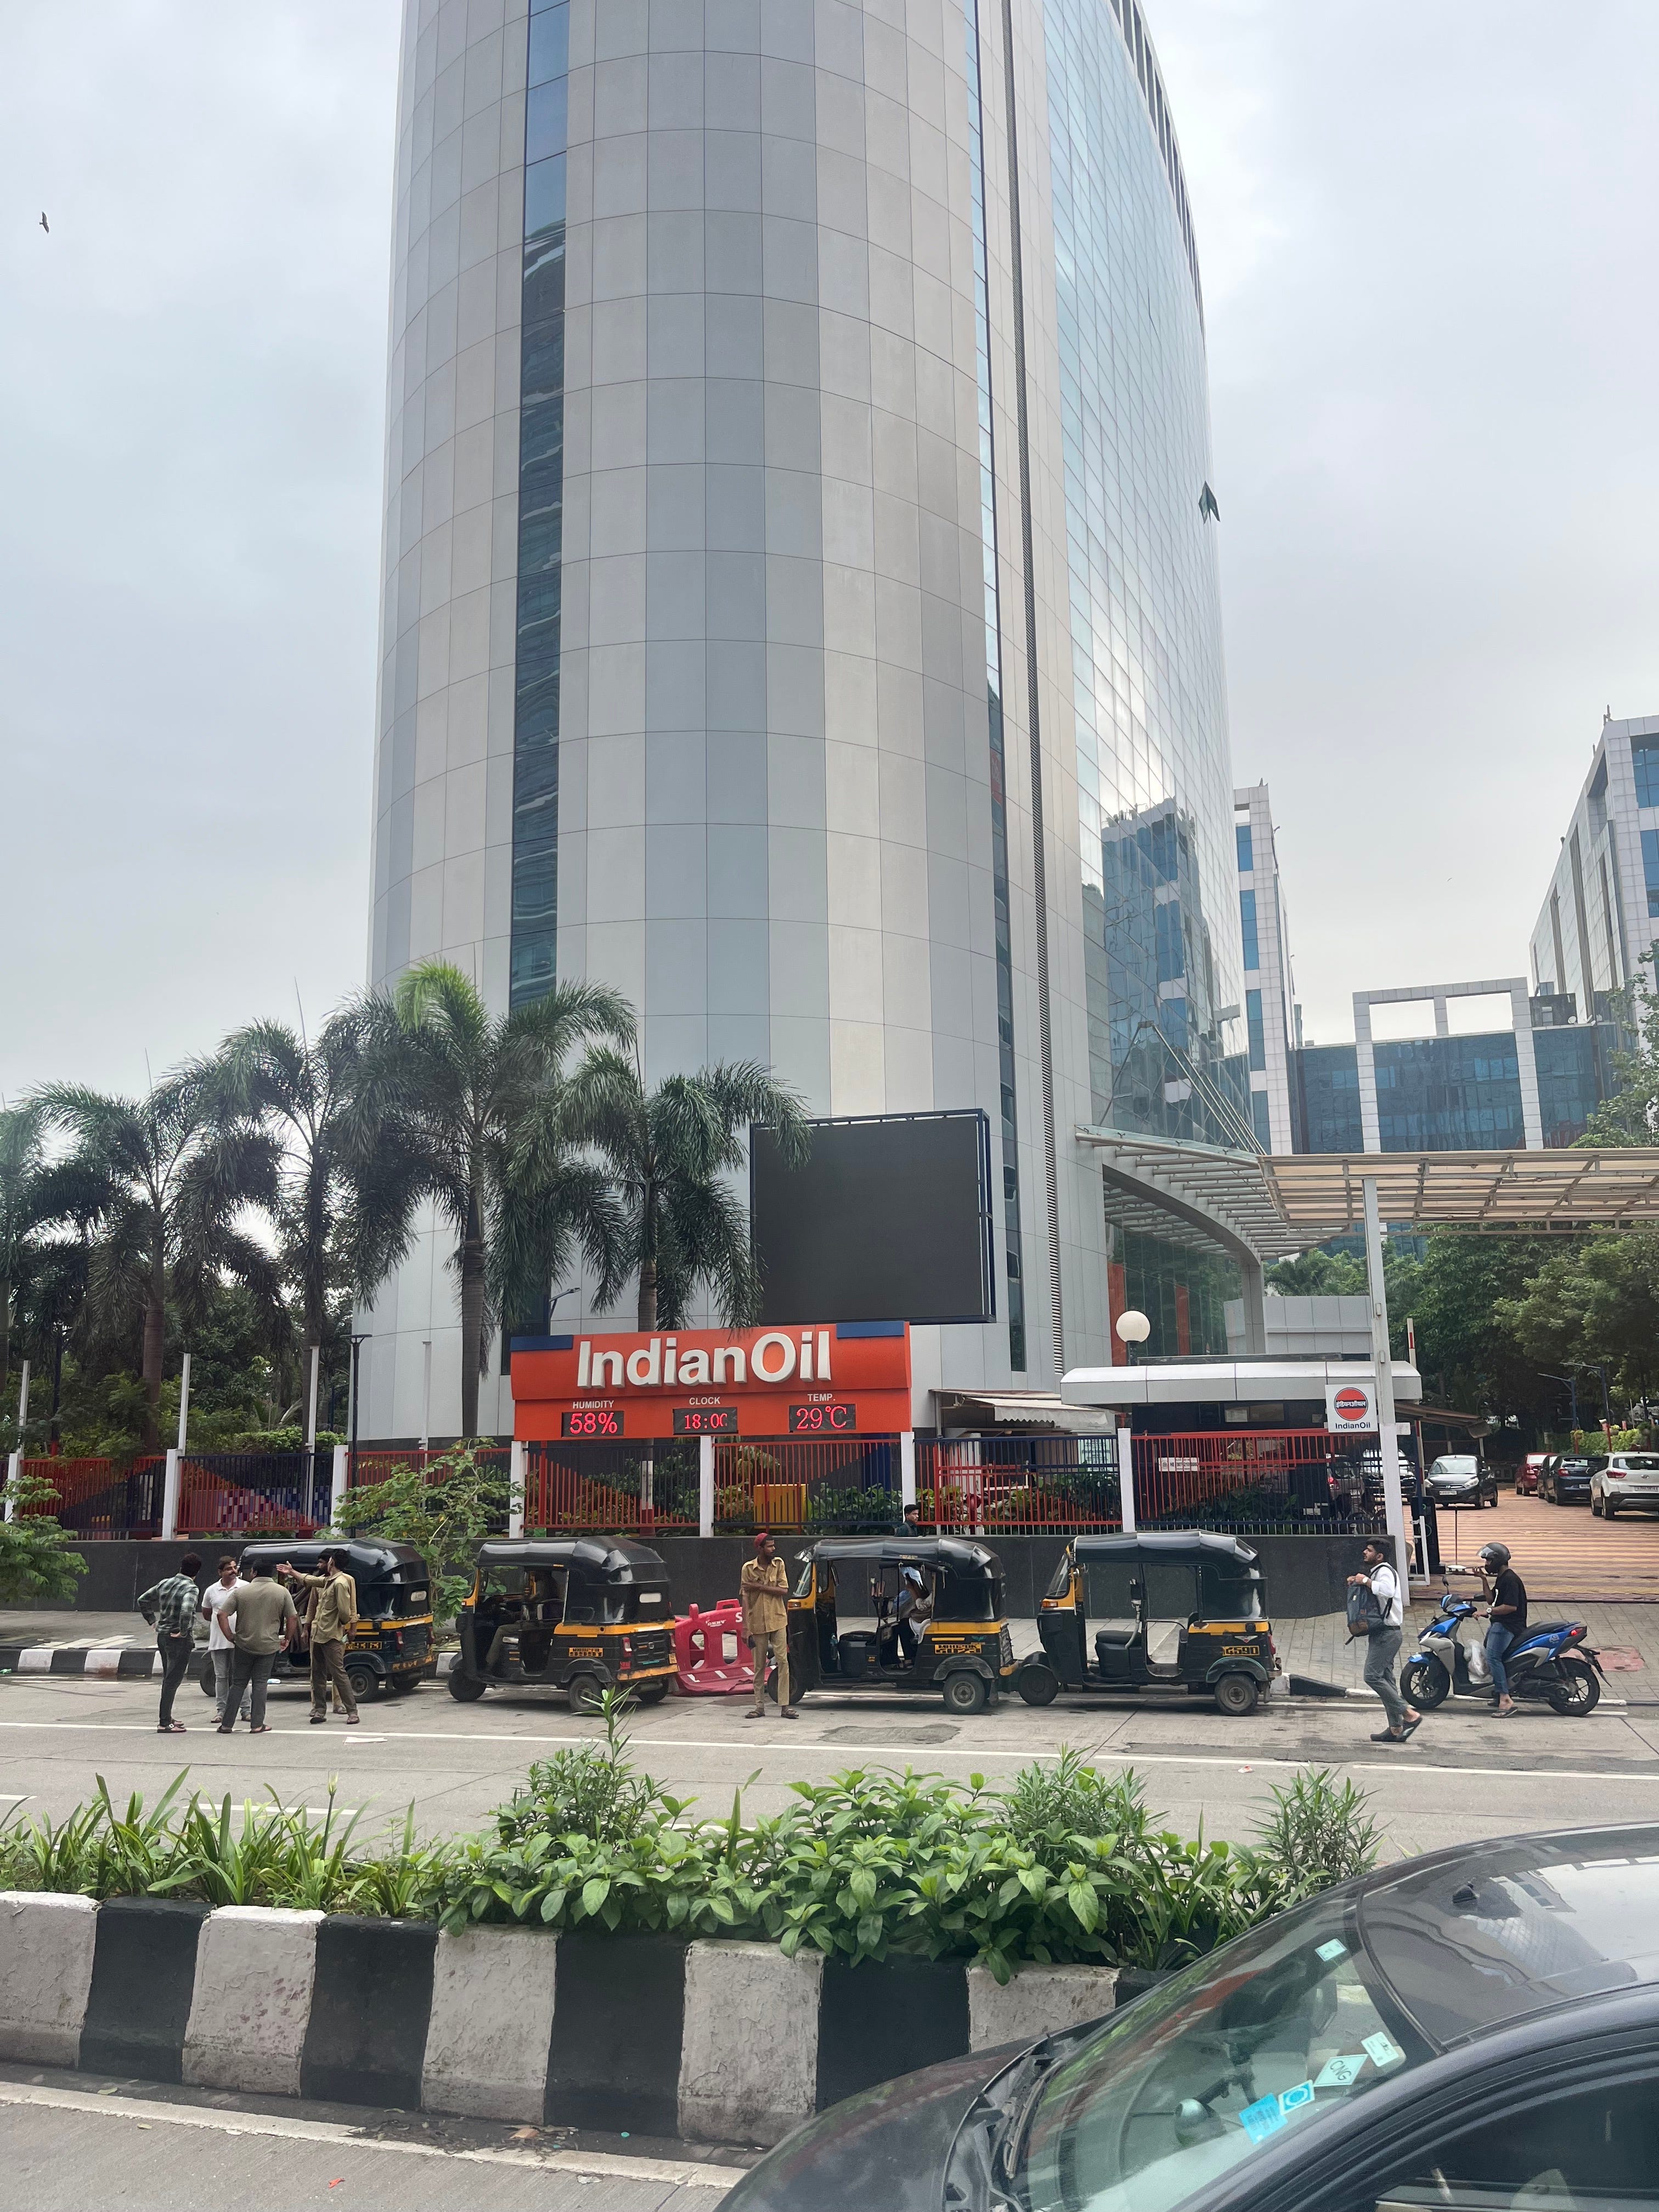
June 30, 2026, against a profit of ₹6,808 crore in the same quarter last year, on standalone terms the loss ran even deeper, ₹2,661 crore. Revenue still rose, to ₹2.82 lakh crore from ₹2.22 lakh crore a year earlier, because the Indian Crude Basket averaged $100.74 a barrel in the quarter, up 21.4% from Q4, driven by the same regional conflict already covered across several issues in this project. A company selling more rupees of fuel than ever and still posting a loss is not a contradiction. It is the exact mechanical result of a business that buys crude at a floating international price and sells fuel at a price it does not fully control, in a quarter when those two lines moved apart faster than the third player in the middle, the marketing margin, could absorb.
The same quarter’s crude spike landed on three Indian refiners in three completely different ways, and that divergence is the real subject of this piece. Indian Oil, a public sector undertaking with a social mandate to keep pump prices politically tolerable, absorbed the spike as a margin squeeze and a loss. Reliance Industries, running the Jamnagar export refining complex largely outside the domestic retail price net, absorbed the same spike as a segment EBITDA tailwind, already documented in Issue 82 of this project. Nayara Energy, the former Essar Oil refinery now under EU and US sanctions pressure over its Rosneft ownership, absorbed the spike from inside a completely different bottleneck, unable to source non Russian crude at all, running its Vadinar plant almost entirely on discounted Russian barrels while losing access to Western banking and shipping insurance. Same barrel of oil, same quarter, three structurally different businesses, three different outcomes. Understanding why requires walking the entire IOC value chain first, because IOC is the baseline every other Indian refiner gets measured against.
The Value Chain, Segment By Segment
Refining. IOC operates 11 refineries with a combined capacity of 80.80 MMTPA, including 10.5 MMTPA held through subsidiaries, roughly 31% of India’s total refining capacity. FY24 crude throughput reached 73 MMT against 68 MMT in FY22, with utilization running at 105% of nameplate capacity in FY24, meaning the existing refineries are already being pushed past their designed throughput to meet demand, the clearest possible signal that the capex program below is not optional expansion but a response to a system already running hot. Refining margin, the Gross Refining Margin or GRM, is the segment’s core unit economic, the difference between the value of the refined products a barrel yields and the cost of the crude and processing that produced them, and it swung from $8.6/bbl in Q1 FY26 to a much weaker level in Q1 FY27 as the crude cost side of that equation spiked faster than product prices could adjust, the direct mechanical cause of this quarter’s loss.
Marketing and retail. Petroleum products marketing is IOC’s largest segment by revenue share, roughly 94 to 95% of the business depending on the year, distributed through more than 60,900 touch points, giving IOC a 42% market share in petroleum, oil and lubricants nationally. This is where petrol, diesel, and Aviation Turbine Fuel, ATF, reach the end customer, and it is also the segment most directly exposed to the government pricing intervention discussed below, because retail prices are the politically visible number every consumer and every state election campaign watches.
Petrochemicals. Sold under the PROPEL brand, exported to more than 70 countries, and IOC’s second largest domestic petrochemicals position after Reliance. The core assets are a world scale naphtha cracker at the Panipat refinery complex feeding four downstream polymer units, an integrated Para Xylene and Purified Terephthalic Acid, PX/PTA, plant at Panipat producing polyester intermediates, and the country’s largest Linear Alkyl Benzene, LAB, plant, the key detergent feedstock, at the Koyali refinery. IOC’s own stated target is to lift its Petrochemical Intensity Index, the share of refinery output value captured as petrochemicals rather than fuel, from roughly 6.11% currently to 15% by 2030, the single clearest evidence that management sees petrochemicals, not fuel, as where future margin growth has to come from, a shift also visible in ExxonMobil’s and Saudi Aramco’s own strategies globally.
Gas and city gas distribution. IOC entered natural gas marketing in 2004 and has built out an LNG at the doorstep model to reach bulk industrial users located away from pipeline infrastructure. Across FY26, IOC’s own pipeline network moved 102.5 MMT of liquid product and 3,991 MMSCM of natural gas, run through a hydrocarbon pipeline system the company describes as pioneering in India, dating back to the 1964 Guwahati Siliguri product pipeline, one of the first product pipelines built east of Suez. India’s broader city gas distribution sector reached roughly 15.3 million piped natural gas connections as of May 2025, with the national authorised gas pipeline network standing at 34,233 km as of March 2025, of which 25,429 km is operational, and IOC is one of a handful of entities, alongside GAIL, building out the pipeline backbone that CGD distribution ultimately connects into.
Upstream. A genuinely small piece of IOC’s business, exploration and production activity conducted mostly through joint ventures and stakes rather than as a standalone profit driver, the mirror image of Vitol’s own token 93 kboepd production position covered in Issue 82’s companion piece, a downstream and midstream giant holding just enough upstream exposure to stay informed about crude markets rather than to profit meaningfully from producing crude itself.
The Capex Plan, And What Can Actually Be Verified About Its Unit Cost
As of June 30, 2026, IOC had seven major projects underway with gross approved costs totalling approximately ₹104,282 crore, physical progress ranging from 65% to 95%. The Panipat refinery expansion, lifting capacity from 15 MMTPA to 25 MMTPA, stood at 94% complete. The Gujarat refinery expansion, 13.7 MMTPA to 18 MMTPA, stood at 89.2%. The Barauni refinery expansion, 6 MMTPA to 9 MMTPA, stood at 91.6%. All three are targeted for commissioning by December 2026. Separately, the Paradip PX-PTA petrochemical complex, part of a broader ₹61,077 crore petrochemical investment program at that site, stood at 94.6% complete with commissioning targeted for August 2026.
Here is where this piece has to be precise rather than convenient. The ₹104,282 crore figure covers all seven major projects combined, not the three refinery capacity expansions in isolation, and IOC’s public disclosures do not break out a clean, verifiable per project cost figure that would allow a defensible per MMTPA unit cost calculation for Panipat, Gujarat, or Barauni individually. The three named refinery expansions add roughly 17.3 MMTPA of combined capacity, 10 MMTPA at Panipat, 4.3 MMTPA at Gujarat, 3 MMTPA at Barauni, but dividing the aggregate ₹104,282 crore figure by that combined capacity number would silently fold in the Paradip petrochemical spend and any pipeline or distribution infrastructure spend bundled into the same seven project total, producing a unit cost figure that looks precise and is not. The honest version of this section is that IOC’s refinery expansion capex is running in the range of several thousand crore per MMTPA of added capacity based on comparable global brownfield refinery expansion benchmarks, but a company specific, project specific unit cost for Panipat, Gujarat, or Barauni individually is not something this project can currently verify from public disclosure, and any number claiming that precision should be treated with suspicion until IOC itself publishes a project level capex breakdown.
The Unit Cost Of Distribution, Which IS Precisely Documented
Unlike capex, the retail price build up for petrol and diesel is one of the most publicly documented cost structures in Indian industry, precisely because it is politically sensitive enough that every component gets scrutinised. Of the retail price a consumer pays at the pump, taxes, central excise plus state VAT, typically account for roughly 47% of the total, though this varies meaningfully by state since VAT is a state subject, Goa’s decision to cut petrol VAT to 0.1% in 2012 being the case where a single state briefly made petrol cheaper than diesel nationally. Of the remaining, non tax portion, roughly 51% covers the refinery gate cost of the product plus transportation to the retail outlet, and the dealer, the actual petrol pump operator, is typically left with a commission of around 2% of the final price. This is the real unit economics of Indian fuel retailing, a business where the party bearing the retail brand and the customer relationship keeps a low single digit percentage margin, while the government’s tax take and the refiner’s product cost together account for essentially the entire price.
Government Intervention, The Structural Constraint IOC Cannot Escape
India ran an Administered Pricing Mechanism, APM, from 1975 to 2002, government set prices based on cost plus guaranteed returns, funded through an Oil Pool Account that smoothed the gap between international and domestic prices. The APM was formally dismantled in 2002, replaced by Trade Parity Pricing from 2006, and full deregulation arrived in two separate steps, petrol effective June 26, 2010, diesel effective October 19, 2014, both following recommendations from a series of government appointed committees, Rangarajan in 2006, Parikh in 2010, Kelkar in 2012, each concluding that continued price control was fiscally unsustainable. A system of daily price revisions, reflecting global crude and currency movements in near real time, began in June 2017, in theory completing the transition to a market linked pricing model.
In practice, deregulation has never meant the government stays out of pricing entirely, and the mechanism by which it intervenes is the single most important structural fact for understanding why IOC’s quarterly results move the way they do. Public sector Oil Marketing Companies routinely freeze retail prices during periods of high volatility or, more pointedly, around state and national elections, absorbing the gap between rising international crude and frozen domestic pump prices as an under recovery, a burden historically shared between the government, through subsidies, and the OMCs themselves, through margin compression. The clearest recent example, well documented in Indian financial press, is the roughly 137 day freeze on retail petrol and diesel prices that ran from November 2021 through March 2022, spanning assembly elections in five states including Uttar Pradesh, even as international crude rose sharply following Russia’s invasion of Ukraine, followed by a sharp one time price increase once the election cycle concluded. This is not a one off event. It is the recurring pattern that makes IOC’s marketing segment fundamentally different from a genuinely free market fuel retailer, a business that is legally deregulated on paper and politically regulated in practice, and it is the single largest reason a quarter of rising crude prices, like the one just reported, produces an IOC loss rather than simply a thinner margin.
The Reliance And Nayara Phenomenon, And What Happened To Essar
Reliance Industries operates its own enormous refining complex at Jamnagar largely as an export oriented business, selling the bulk of its refined product output into international markets rather than the domestic retail network that IOC, along with fellow PSUs BPCL and HPCL, is expected to serve at politically managed prices. This structural choice is why the same Q1 FY27 crude spike that produced an IOC loss instead produced a segment EBITDA tailwind for Reliance’s O2C business, already documented in this project’s Issue 82, Reliance captures the benefit of higher international product prices on export volumes without carrying the domestic retail pricing obligation that constrains IOC’s marketing segment.
Nayara Energy sits at the opposite extreme, and its story begins as Essar Oil, a company that ran the 20 MMTPA Vadinar refinery in Gujarat, India’s second largest single site refinery, generating roughly 8% of India’s total refining output, before financial distress forced a sale. Essar Oil was delisted from Indian exchanges in a leveraged buyout that closed December 30, 2015, valuing the company at ₹380B, $5.3B. In August 2017, Rosneft acquired a 49.13% stake, and Kesani Enterprises, a consortium combining Trafigura, the trading house profiled in this project’s most recent issue, and United Capital Partners, a Russia linked investment fund, acquired a matching 49.13% stake, together with captive port and power assets, at a total enterprise value of $12.9B. The renamed Nayara Energy grew steadily, crossing 7,000 retail outlets by mid 2026, roughly 7% of India’s retail fuel network. Then, on July 18, 2025, the European Union’s 18th sanctions package against Russia designated Nayara directly, banning imports of petroleum products refined from Russian crude into the EU, restricting the refinery’s access to EU shipping insurance and financial services, and imposing a $47.6 a barrel price cap on Russian crude. The United States added further restrictions targeting Rosneft in October 2025. The immediate effect was severe, crude intake at the 400,000 barrel a day Vadinar plant fell to roughly 240,000 barrels a day once Saudi and Iraqi suppliers, wary of sanctions exposure, declined contracted volumes, leaving Nayara dependent entirely on Russian crude grades. Throughput recovered to roughly 420,000 barrels a day, above the plant’s original design capacity, by November 2025, running almost exclusively on discounted Russian oil. Indian lenders including State Bank of India halted trade and foreign currency transactions for Nayara as a precaution against Western regulatory exposure, and the company has since sought alternative banking relationships with domestic institutions carrying minimal Western exposure, the same workaround Indian entities used to keep trading with Iran under an earlier sanctions regime.
Three refiners, three structures, three outcomes from the identical crude spike. IOC, price regulated and politically exposed, absorbs volatility as a loss. Reliance, export oriented and largely outside the domestic price net, captures volatility as a tailwind. Nayara, foreign owned and geopolitically exposed through its Rosneft shareholding, absorbs a completely different kind of shock, not price volatility but market access volatility, unable to freely choose its own crude suppliers or banking partners regardless of what the barrel actually costs. IOC’s own management has no lever to pull that converts it into either of the other two models. It is a public sector company built to serve retail demand at politically tolerable prices, and that mandate, not any operational failing, is the root cause of a quarter where revenue grew and profit still turned negative.
The Stress Test
IOC’s debt equity ratio stood at 0.69 and its current ratio at 0.76 as of the June 2026 quarter, operating margin compressed to a bare 0.12% and net margin to negative 0.40%, figures that describe a company whose balance sheet is not distressed but whose operating economics were squeezed to almost nothing in a single quarter by the gap between crude cost and administered retail pricing. The real question for the next several quarters is whether the ₹104,282 crore capex program, adding refining capacity that is already running at 105% utilization and pushing hard into petrochemicals to lift margin quality, arrives fast enough to give IOC a structurally wider buffer before the next crude spike lands, or whether the company will spend the intervening quarters absorbing under recoveries the same way it just did, waiting for a political cycle to allow the next price pass through.
Sources: Indian Oil Corporation Limited Q1 FY27 investor handout and results announcement, August 1, 2026. Free Press Journal and Investing.com reporting on IOC Q1 FY27 consolidated results. Screener.in company disclosure summary on IOC business segments and refining capacity. IndianOil pipeline and petrochemicals project disclosures, iocl.com. Indian Infrastructure magazine reporting on national gas pipeline and CGD network data, August 2025. PMFIAS and IJPIEL summaries of India’s fuel pricing deregulation history, APM to daily pricing. Business Standard, Al Jazeera, and Fuels & Lubes Asia reporting on Nayara Energy’s ownership history and 2025-2026 EU and US sanctions exposure. Rosneft Oil Company public statement on EU sanctions against Nayara Energy.