
Samudra Manthan: What ₹84,084 Crore Actually Buys, And What ONGC’s Own History Says About Whether It Will Work
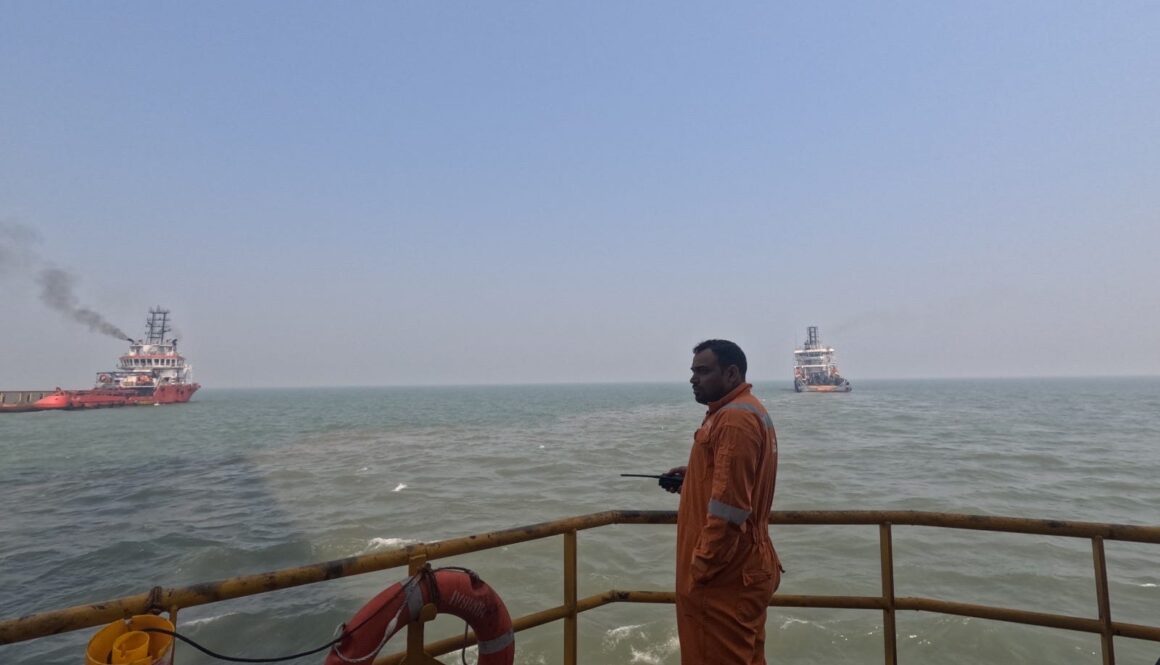
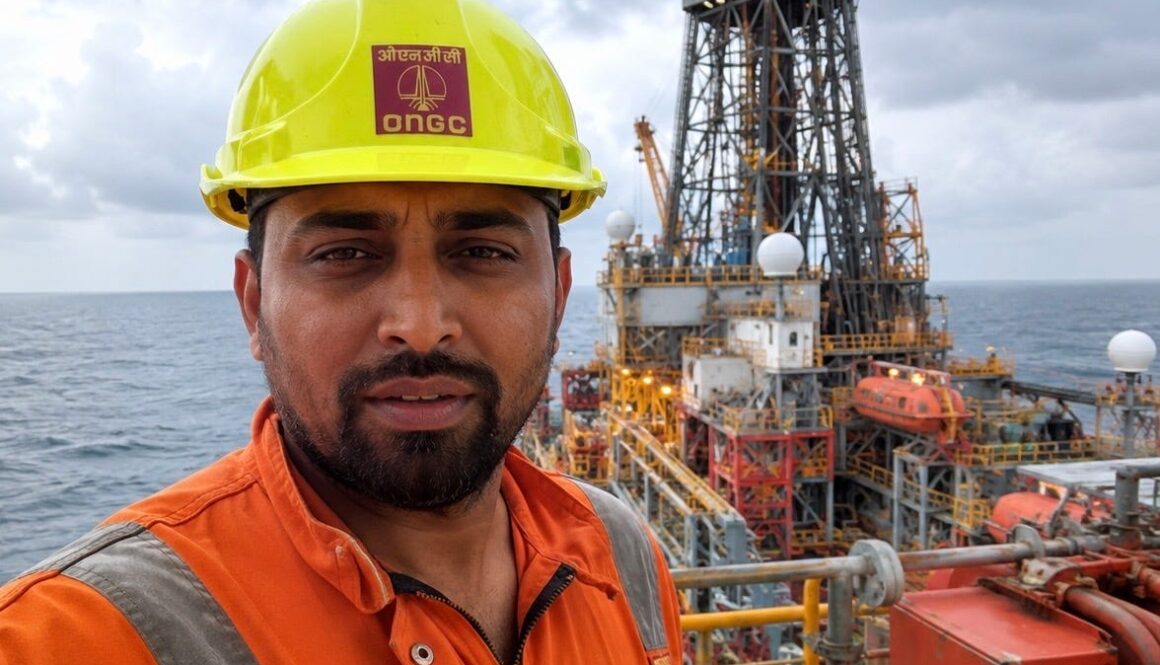
On July 25, 2026, ONGC spudded well MN-DW18-1-H-D, the first well drilled under
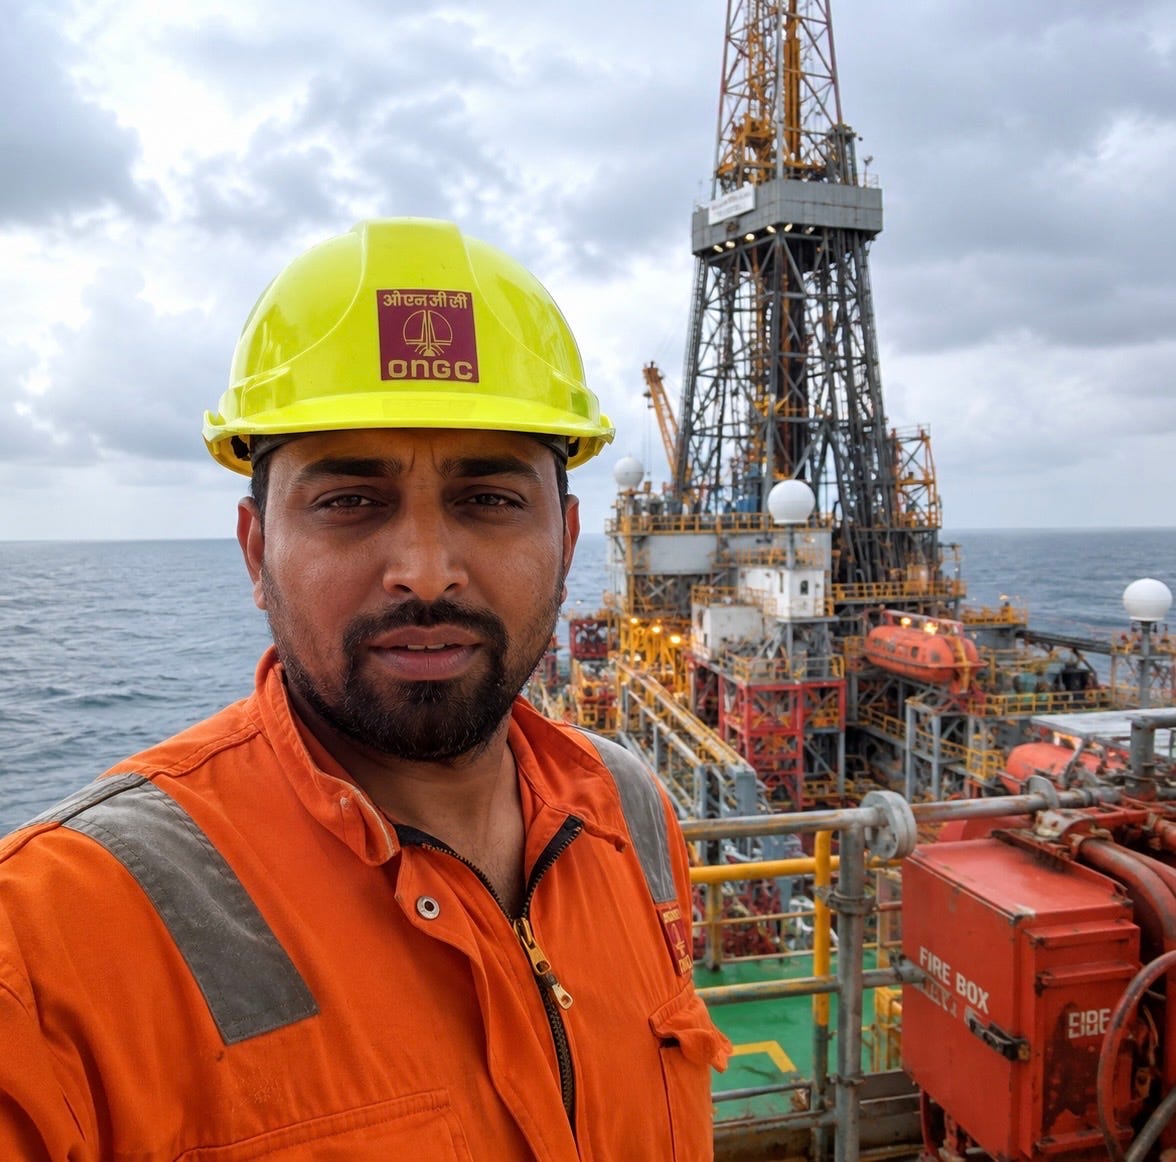
Samudra Manthan, the National Offshore Exploration Scheme the Union Cabinet had approved just six days later, on July 31, with a Phase I outlay of ₹84,084 crore running through FY 2030-31. Most of what has been written about this scheme since Cabinet approval repeats the headline number and the Prime Minister’s Independence Day 2025 framing of a modern day churning of the ocean. None of it has walked through what the money actually buys, what similar bets have cost elsewhere in the world, or what ONGC’s own twenty five year history with exactly this kind of project already tells you about the odds. This piece is written to close that gap.
What The Scheme Actually Funds
Samudra Manthan is structured around four components, and the allocation across them tells you where the government believes the real bottleneck sits. The largest single line is drilling itself, ₹43,200 crore earmarked for 60 deepwater exploration wells, with government support capped at 50% of eligible drilling cost or ₹675 crore per well, whichever is lower. Seismic data acquisition and processing, the large scale 2D and 3D surveys needed to even identify where those 60 wells should go, carries ₹28,534 crore. A further ₹10,000 crore is earmarked for common offshore infrastructure hubs, shared production and evacuation infrastructure multiple operators can use rather than each building their own. The smallest component, ₹2,000 crore, funds oil and gas manufacturing and service zones, a Make in India push to build domestic supply chains for the specialised equipment deepwater drilling requires, an amount that, set against the KG-DWN-98/2 project’s own documented losses from international equipment sourcing detailed below, reads like a direct policy response to a specific, already experienced problem rather than a generic industrial policy gesture.
Run the arithmetic on the drilling component and something worth flagging emerges. ₹43,200 crore divided across 60 wells averages ₹720 crore per well in government allocation, slightly above the stated ₹675 crore per well cap. Since the cap only binds when 50% of a well’s eligible cost exceeds ₹675 crore, meaning the well itself costs more than roughly ₹1,350 crore, and independent reporting puts actual deepwater well costs in the Krishna-Godavari, Cauvery, Mahanadi and Andaman basins targeted by this scheme at $125M to $150M, roughly ₹1,040 crore to ₹1,245 crore at current exchange rates, most individual wells should fall under the cap and receive the full 50% share rather than the capped amount. The average allocation running above the per well cap suggests either a meaningful share of the 60 wells are budgeted at the more expensive end of that range, plausibly the Andaman basin, described by ONGC as reaching some of the deepest water in the programme, or the allocation includes a contingency buffer above the strict per well arithmetic. Either way, the operator, ONGC, Oil India, or a private participant, is still funding roughly half of a $125M to $150M well from its own capital, meaning Samudra Manthan de risks deepwater exploration without eliminating the capital commitment required to actually drill.
The Basins, The Targets, And What “600 MMTOE” Actually Means
The scheme targets India’s deepwater and ultra-deepwater frontier, specifically the Krishna-Godavari, Cauvery, Mahanadi and Andaman basins. The government’s own stated expectation is reserve accretion of over 600 million metric tonnes of oil equivalent, MMTOE, a figure worth treating carefully rather than as an existing discovery. Separately, geophysical modelling and basin analogy studies referenced in industry coverage of the scheme put the total prospective resource across these basins as high as 5,600 MMTOE, a number explicitly caveated by the analysts citing it as reflecting what the geology could plausibly hold, not what has been confirmed by drilling. The distinction between these two figures, 600 MMTOE as the scheme’s targeted accretion and 5,600 MMTOE as the theoretical total prospective resource, is the difference between a business plan and a geological fantasy map, and any reader encountering the larger number without this context is being given a headline, not information.
Work Already Done, And The Timeline From Here
Beyond the first spud on July 25, 2026, ONGC has established DeepX, a dedicated deepwater exploration task force operating as a mission mode unit rather than a rebranded department, staffed with more than 30 domain specialists under a stated philosophy of “One Company, One Data,” centralising subsurface intelligence across the corporation’s deepwater portfolio in an explicit attempt to compress the gap between discovery and development, the exact gap that stretched to more than two decades in ONGC’s earlier flagship deepwater project, detailed below. ONGC’s own public statements describe plans to drill up to 150 deepwater exploratory wells over a seven year window through FY 2030-31, a figure larger than the scheme’s own 60 well subsidised target, meaning ONGC intends to fund a meaningful share of its deepwater drilling from its own capital programme rather than relying solely on Samudra Manthan support, consistent with the government’s stated reorientation of ONGC’s and Oil India’s performance metrics to place greater weight on exploration activity specifically.
The phased implementation described in scheme documentation runs seismic vessel deployment and 2D and 3D data acquisition across priority basins first, followed by identification of high prospectivity blocks warranting exploratory drilling, establishment of digital data management infrastructure, and international outreach for technology partnerships, before the drilling campaigns themselves scale up, running in parallel with scientific drilling in frontier basins intended to establish geological baselines rather than target immediate commercial production. Construction of common offshore production facilities and evacuation pipelines follows discovery, not precedes it, meaning the ₹10,000 crore infrastructure allocation is deliberately sequenced to avoid the exact trap of building fixed infrastructure ahead of confirmed reserves, a trap ONGC’s own KG basin project fell into more than once.
The Challenges The Government’s Own Documentation Names
Scheme documentation is unusually direct about the non commercial constraints layered on top of the geological and cost risk. Marine biodiversity protection is named explicitly, particularly in ecologically sensitive zones where seismic survey activity and drilling can affect cetacean populations and benthic ecosystems, alongside India’s UNCLOS obligations governing exploration activity within its Exclusive Economic Zone and continental shelf. Well integrity and blowout prevention standards are described as informed directly by lessons from the 2010 Deepwater Horizon disaster, which reshaped global regulatory expectations for subsea well control industry wide, and seismic survey mitigation protocols, soft start procedures and marine mammal observers, are built into the programme rather than treated as an afterthought. None of this is unusual by global deepwater standards, but naming it explicitly in the scheme’s own public documentation suggests the government is anticipating environmental and regulatory friction as a real constraint on timeline, not a formality.
ONGC’s Own History, The Case That Matters Most Here
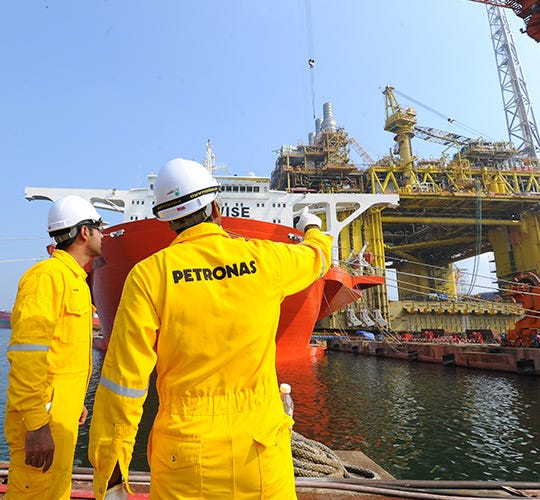
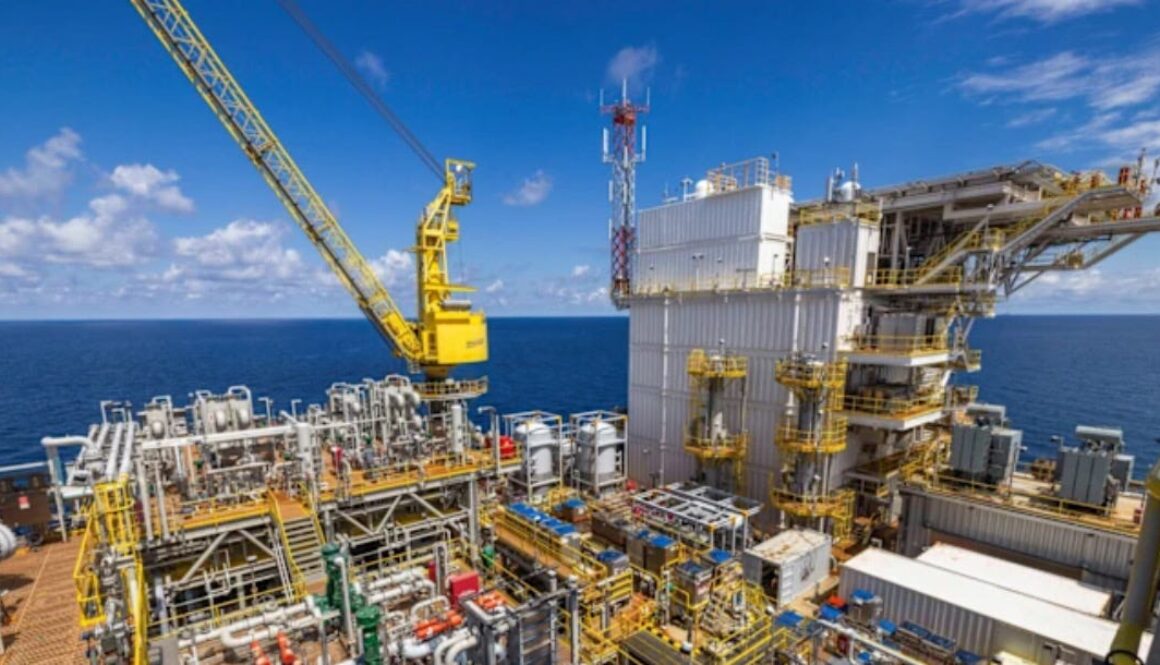
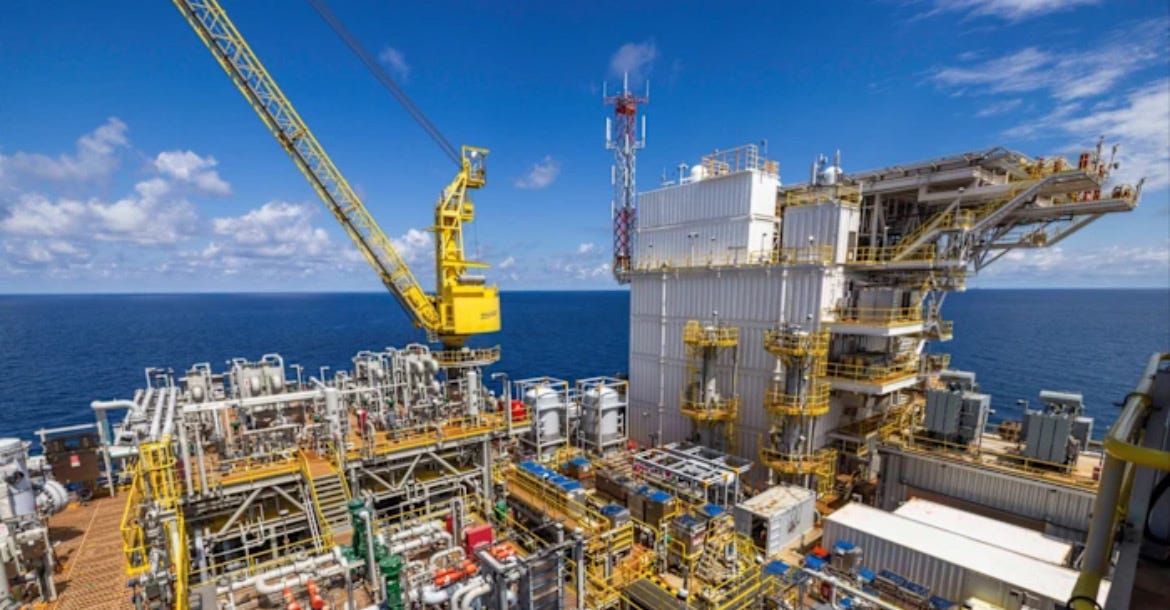
Samudra Manthan is not India’s first attempt at ultra-deepwater development, and the KG-DWN-98/2 block offers the most instructive prior context available in the public record for what this kind of programme actually involves on the ground. The block, awarded under the first New Exploration Licensing Policy round, sits 22 to 45 km off the Andhra Pradesh coast in the Krishna-Godavari basin, spanning 7,294 sq km with water depths from 320 to 3,100 metres and drilling depths of 2,000 to 3,000 metres below the seabed, genuinely ultra-deepwater conditions by any global standard. Reserve estimation in a basin this technically novel carries inherent uncertainty, and the block’s early estimates drew commentary from other operators in the region working with their own basin data, a normal feature of frontier exploration anywhere in the world. Investment across Cluster I, II and III, with Cluster III alone reaching roughly 2,600 metres of water depth, grew to $9 billion to $10 billion, roughly ₹65,000 crore, by 2017.
The public record shows execution ran into the kind of complexity ultra-deepwater projects worldwide routinely encounter. The development was structured across more than 35 separate work packages, and interface challenges between subsea systems and surface platforms contributed to cost movement of roughly $100M tied to design coordination, alongside an estimated ₹5,500 crore in additional forex exposure from international sourcing of specialised equipment, the exact category of cost the new scheme’s ₹2,000 crore domestic manufacturing allocation is now aimed at reducing industry wide. Difficult subsurface and equipment conditions, including power and casing issues common to ultra-deepwater operations globally, affected several wells during development. The block’s waxy crude required a genuinely novel engineering response, Pipe-in-Pipe flow assurance technology, a first of its kind deployment in India combining internationally sourced subsea hardware with domestic fabrication under the Make in India banner, a real technical achievement delivered under difficult operating conditions. Gas production began in March 2020, and pandemic era supply chain disruption affected equipment delivery timelines further. First oil from the M-field, part of Cluster 2, arrived January 7, 2024, at a reported investment north of ₹41,000 crore for that phase, and Prime Minister Modi personally flagged off the first crude tanker, Swarna Sindhu, carrying oil from the project.
The production trajectory illustrates how far actual output in a genuinely novel basin can diverge from early forecasts. The original 2016 projections for the block anticipated peak output of 70,000 barrels of oil per day and 16.3 mmscmd of gas. As of mid 2025, production stood at 33,000 barrels of oil per day and 2.5 mmscmd of gas. This gap, common enough in ultra-deepwater developments globally that it is a recognised category of project risk rather than an India specific outcome, is the backdrop to ONGC’s preliminary talks with ExxonMobil, Shell and BP on a partnership structure for the basin’s remaining complexity, particularly in Cluster 2, currently the only cluster producing oil and gas, with the discussions reportedly structured around genuine financial co-investment rather than a purely advisory role. Shell previously declined an earlier opportunity to partner at Mumbai High. BP already partners with Reliance in an adjacent KG block, a relationship that intersects with an active boundary dispute between Reliance and ONGC.
KG-DWN-98/2 demonstrated that India, and ONGC specifically, can deliver genuinely novel ultra-deepwater engineering, the Pipe-in-Pipe technology chief among it, under some of the most difficult offshore conditions in the world. It also demonstrated, consistent with the global pattern in frontier ultra-deepwater basins from the Gulf of Mexico to West Africa, that the gap between an early geological forecast and eventual production can be wide, and that multi-decade timelines and significant capital commitment are a structural feature of this category of project everywhere it has been attempted, not a uniquely Indian outcome. Samudra Manthan’s DeepX unit, its centralised subsurface data approach, and its domestic manufacturing push all reflect lessons the industry, in India and globally, has drawn from exactly this kind of project experience. Whether those measures are sufficient is the open question the scheme will answer over the next five years, separate from the underlying geological question, which by even the more conservative 600 MMTOE government estimate, looks favourable.
What A Comparable Global FID Actually Costs
The clearest recent international benchmark for a deepwater development at this scale is GranMorgu, TotalEnergies and APA Corporation’s October 2024 final investment decision on Block 58 offshore Suriname, developing the Sapakara South and Krabdagu discoveries. The FID committed $10.5B, close to Samudra Manthan’s entire ₹84,084 crore Phase I outlay, for a single project targeting 760 million barrels of oil equivalent recoverable through 16 production and 16 injection wells feeding an FPSO with 220,000 barrels a day of nameplate capacity, first oil targeted for 2028. That $10.5B against 760 million barrels recoverable works out to roughly $13.80 of capital committed per barrel of confirmed, appraisal drilled reserves, a genuinely useful yardstick because GranMorgu reached FID only after the discoveries were already appraised and the reserves were no longer geological estimates but bookable numbers. Samudra Manthan’s ₹84,084 crore, by contrast, is being committed at the exploration stage, before the 600 MMTOE target has been converted into a single appraised, bookable barrel, a fundamentally earlier and riskier point in the value chain than where TotalEnergies committed its capital in Suriname.
The regional comparison sharpens the point further. Guyana’s Liza and Payara fields, developed by ExxonMobil in the same broader Guyana-Suriname basin system, run breakeven costs of $25 to $32 a barrel, among the cheapest deepwater oil anywhere in the world, while GranMorgu’s own breakeven sits in the $40 to $45 range, still comfortably inside the $25 to $40 band industry screening standards now require before a major will take a deepwater project to FID at all, alongside a post tax internal rate of return hurdle typically set at 15% to 20%. Nothing in Samudra Manthan’s public documentation yet states what breakeven threshold the scheme is underwriting its 60 wells against, and given the range of outcomes seen across ultra-deepwater basins globally, from Guyana’s exceptionally favourable economics to basins requiring longer development timelines elsewhere, that threshold is the single most useful number this programme could still make public. It would let operators, partners, and observers alike measure Samudra Manthan’s progress against a stated target rather than against the headline outlay alone.
Sources: Press Information Bureau, Government of India, Cabinet approval release on Samudra Manthan, August 2026. ANI and offshore-technology.com reporting on the scheme’s four component structure and per well funding cap, August 2026. Discovery Alert reporting on the ONGC Samudra Manthan Mission, DeepX task force, and MN-DW18-1-H-D spud date, August 2026. Bastion Research and Indian Petroplus reporting on KG-DWN-98/2 project history, cost overruns, and technical challenges. OilPrice.com and Zacks Equity Research reporting on ExxonMobil, Shell and BP partnership talks with ONGC, May 2025. Business Standard reporting on ONGC’s KG basin investment plans and production milestones, 2016 through 2024. AAPG Explorer, OilNOW, Offshore Magazine, and Rystad Energy reporting on the GranMorgu FID and Guyana-Suriname basin breakeven economics.